Daily Level Trading Limits
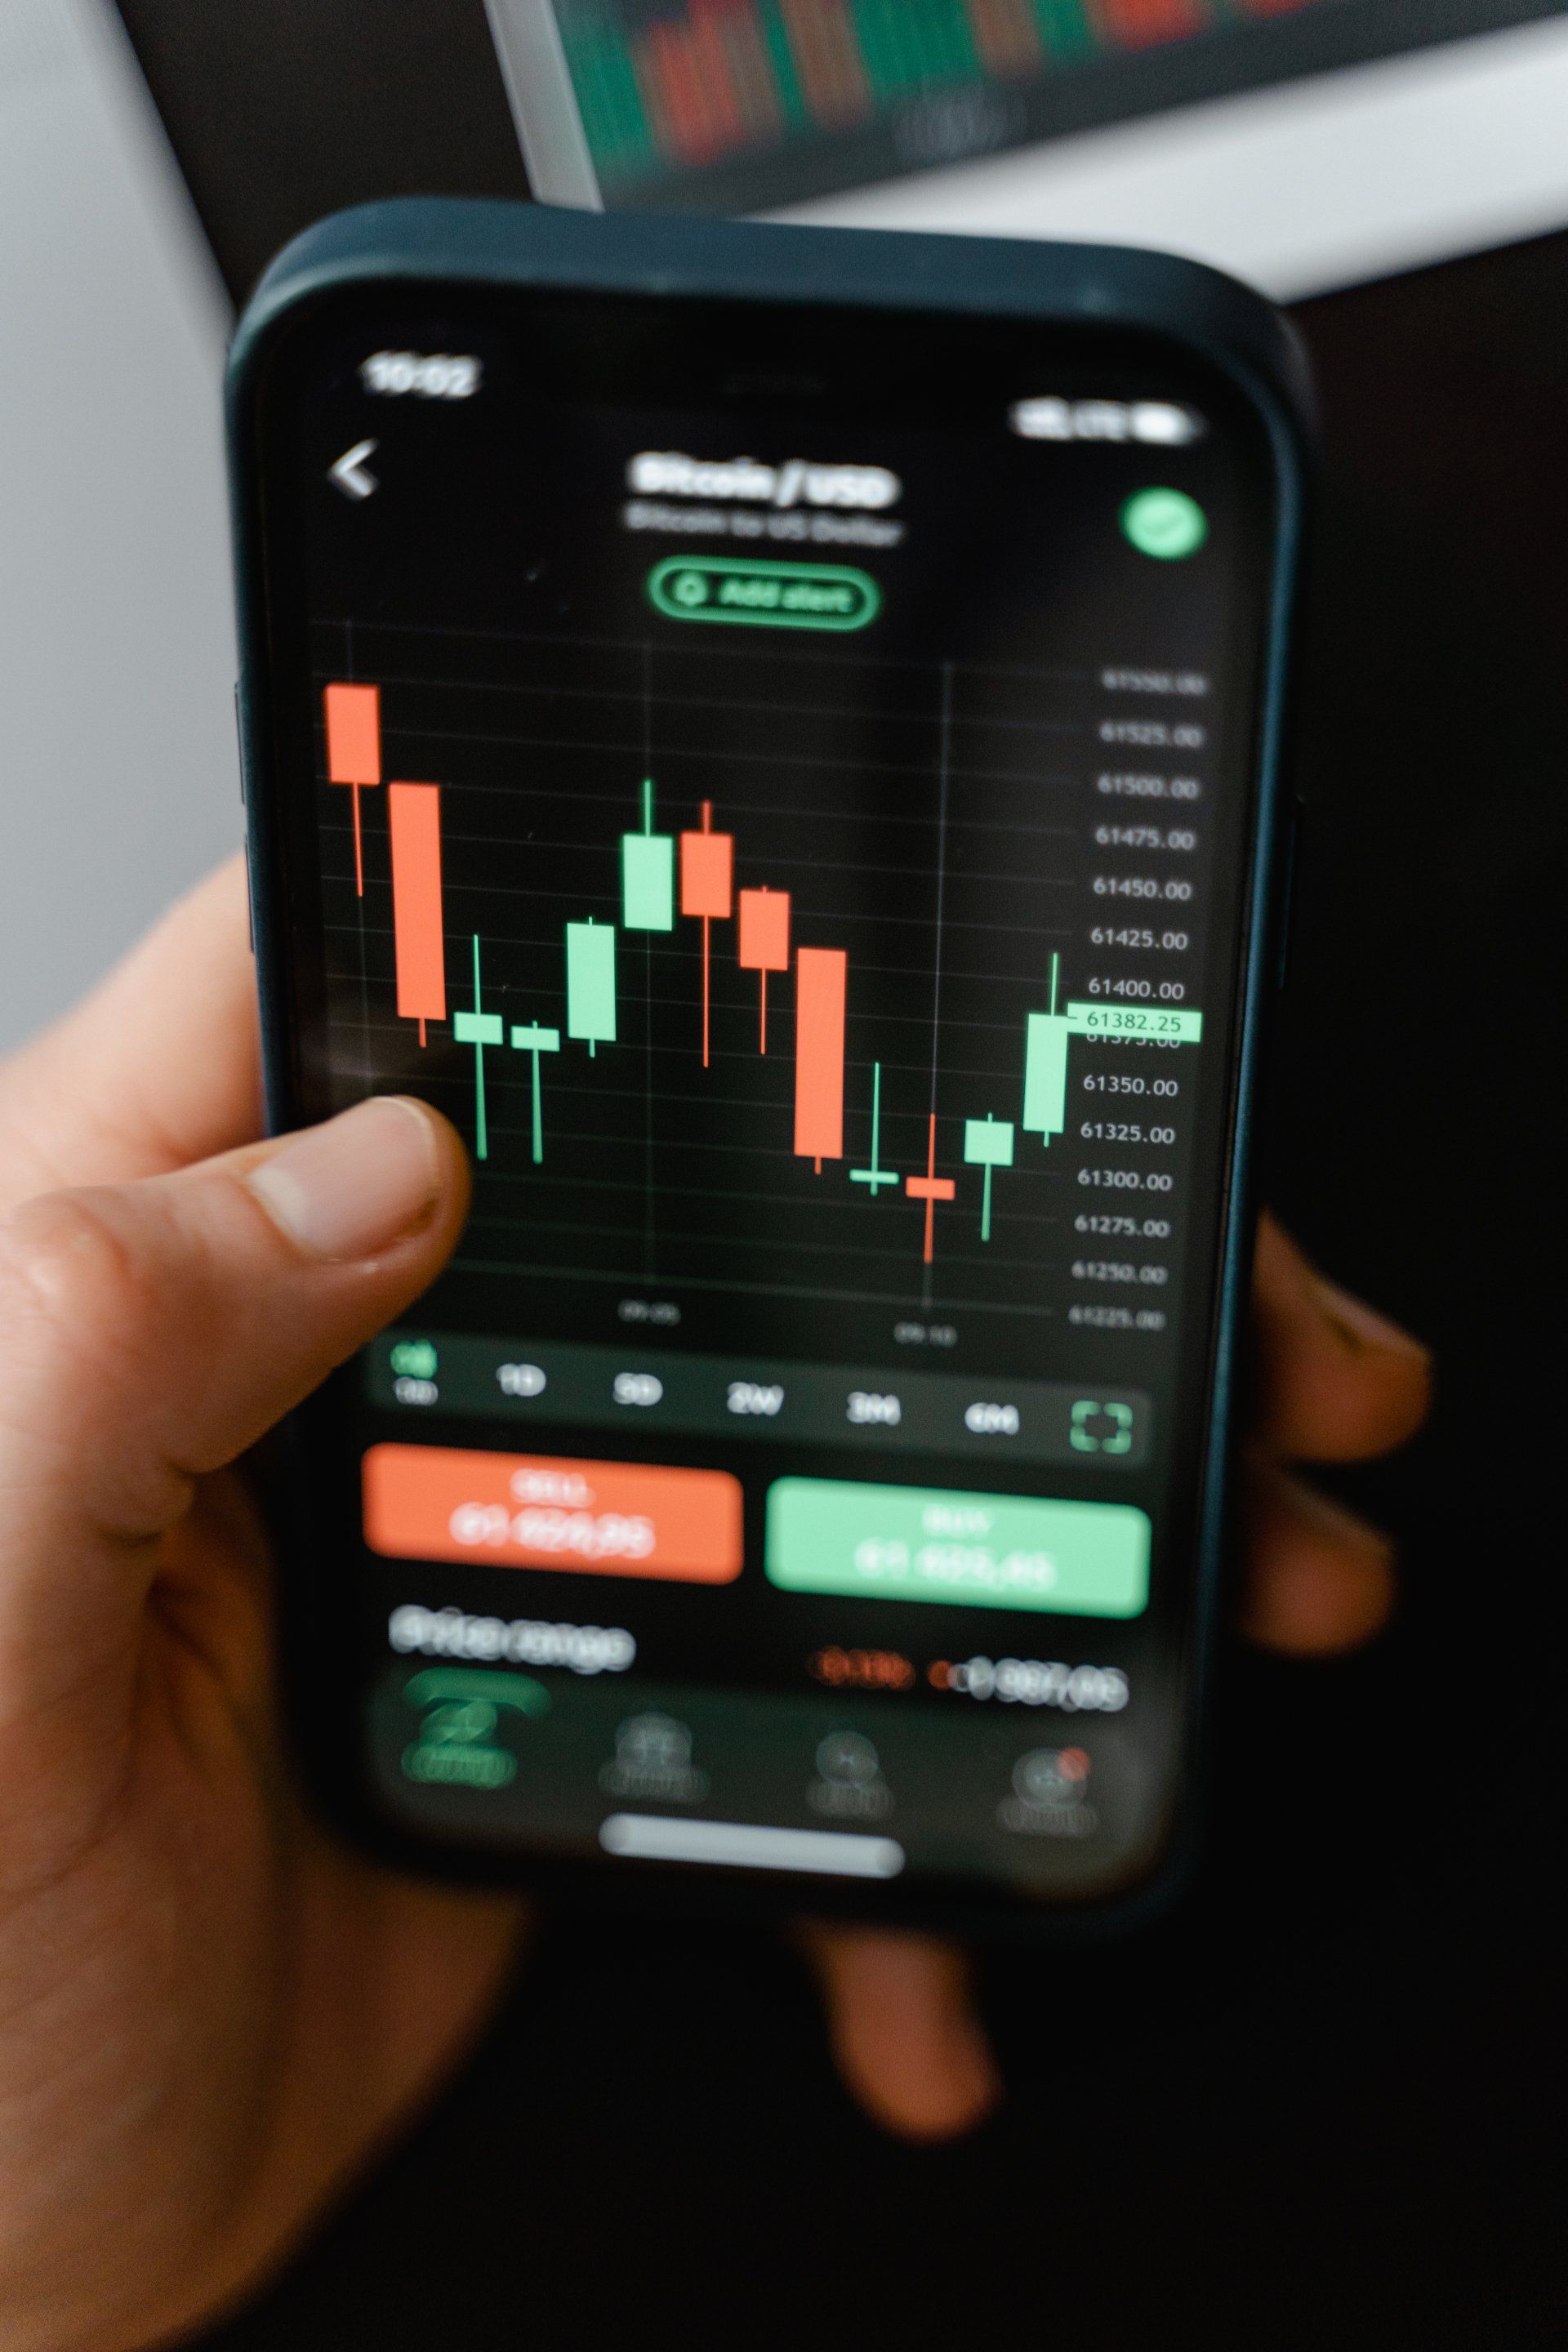
Support and Resistance. Probably the two most important words in trading. As a Trader you no doubt will have heard the phrase 'buy on support, sell on resistance' many times. That's because support and resistance are fundamental concepts within Technical Analysis and understanding what they mean is key to reading price charts.
The financial markets move on the basis of supply and demand. If more people want to buy than sell (demand is greater than supply) then the markets move up. If more people want to sell than buy (supply is greater than demand) then the markets move down.
Levels of support tell you where the market is likely to be bought. Levels of resistance tell you where a market is likely to be sold. Like all things in technical analysis the concepts are relatively straightforward but they can take years to master.
The science (some would say art) of technical analysis enables you to identify levels of support and resistance via chart patterns. There are also many other ways of identifying possible inflexion points in the market on a chart: moving average crossovers, Relative Strength Index (RSI) and Bollinger bands being just a few.
There are multiple lines of support and resistance for any specific market at any given time. Moreover, those lines of support and resistance change whether you are looking at a 3 min, 5 min, 10 min, 1 hour or daily chart. It's important to note that support and resistance on higher timeframes are stronger than support and resistance on lower timeframes. Put another way, if you are trading a 3 min chart you would be wise to understand where the hourly support and resistance sit, because these will be logical turning points for the market and will help you time your entries and exits.
The Inteligex system gives you live dynamic lines of support and resistance and the cribs show you where the market is trying to get to. But given the importance of Daily Levels we still make sure that we put those on our charts. Why? Well the Daily Levels are the strongest and if you are happily riding a trade either long or short and getting close to these lines the market could easily turn.
This short video shows you high to identify those Daily Levels so that you can put them on your charts and improve your trading. It's easy to do on any financial chart, so perfect for any market or stock over any timeframe. It works for stocks, futures, commodities and forex.
If you're interested in improving your manual trading or our AI driven auto-trading solutions then
come talk to us, we are passionate about helping you improve your trading.


